
Section One: Creating our first MDL table
In section one we are going to validate the data and then create our first MDL table which we can configure to intercept logs coming into DDAS as required.
Validating the problem
First part of this lab is to check the data coming into Splunk is actually hitting the DDAS index.
- From your Splunk Cloud console.
Click the Splunk cloud logotop left-hand side. - Next
click on Search & Reportingapp on the left-hand menu. Adjust your timerange picker to last 15 minutesRun the following searchto view our web access logs
index="linux_secure"See example output below.
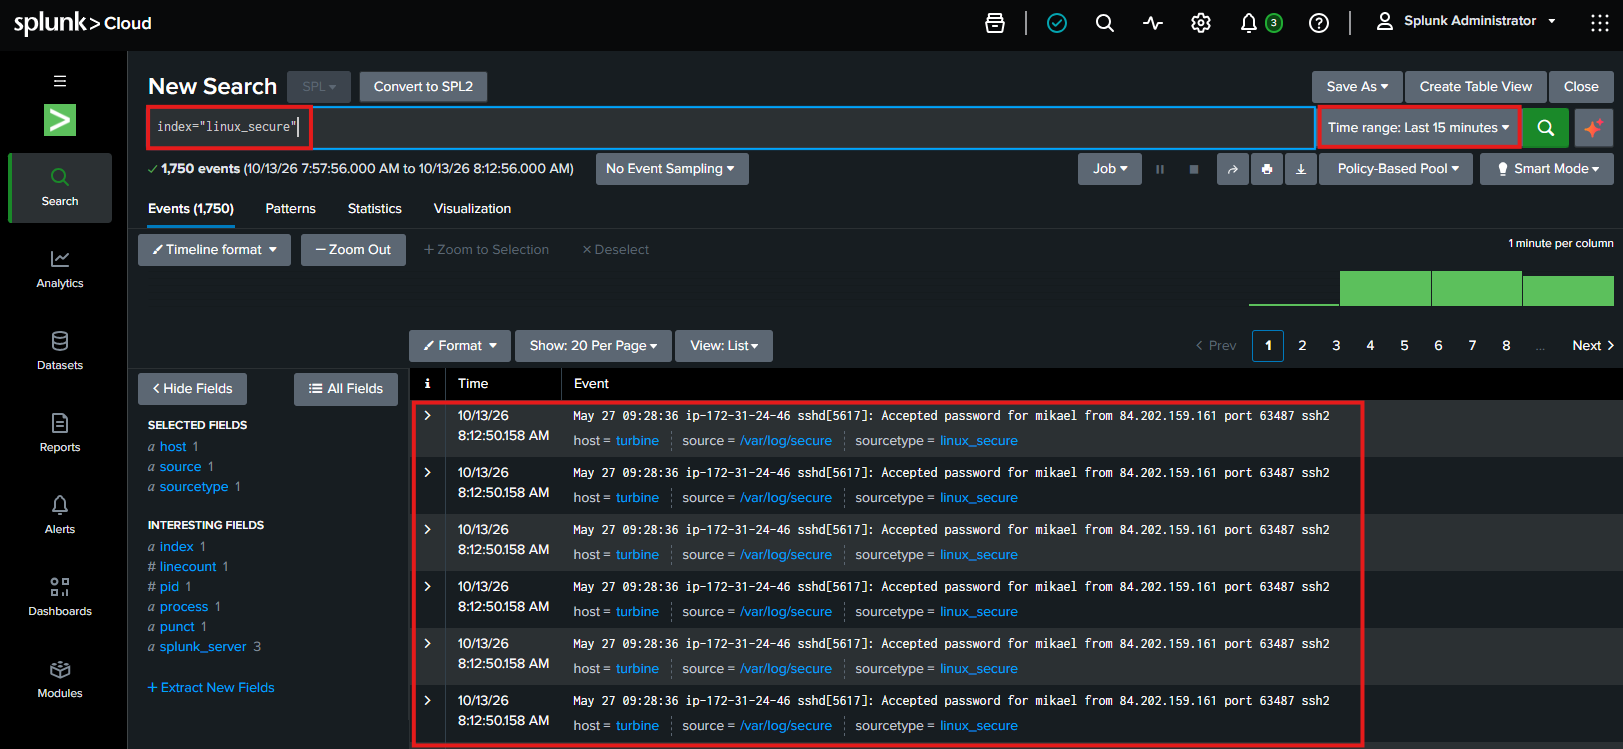
Now that we have confirmed that. Let's create a MDL raw storage destination to route our data to.
Creating a new Machine Data Lake Dataset
Click the Splunk Cloud logoagain on the top left-hand side.Click on Data Management appon the left-hand menu.Click the Datasets optionon the left-hand menu.
From here we have already been in previous labs that there is a default_mdl_raw dataset already. This was created as part of the lab. But for this lab we want to create a new one to route our linux_secure data too.
Click the blue Create dataset button
Like before there are lots of options here. Select the Machine Data Lake (MDL) option. See example below
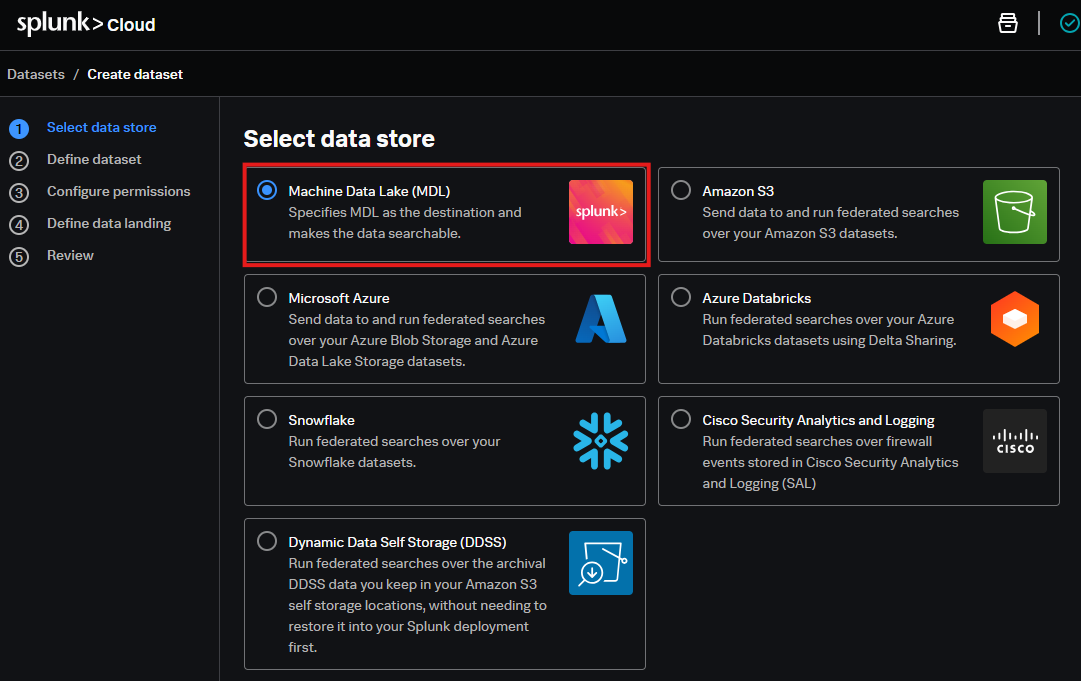
Click Nextwhen ready.- Similar to creating other datasets, we need to enter important information for our MDL dataset.
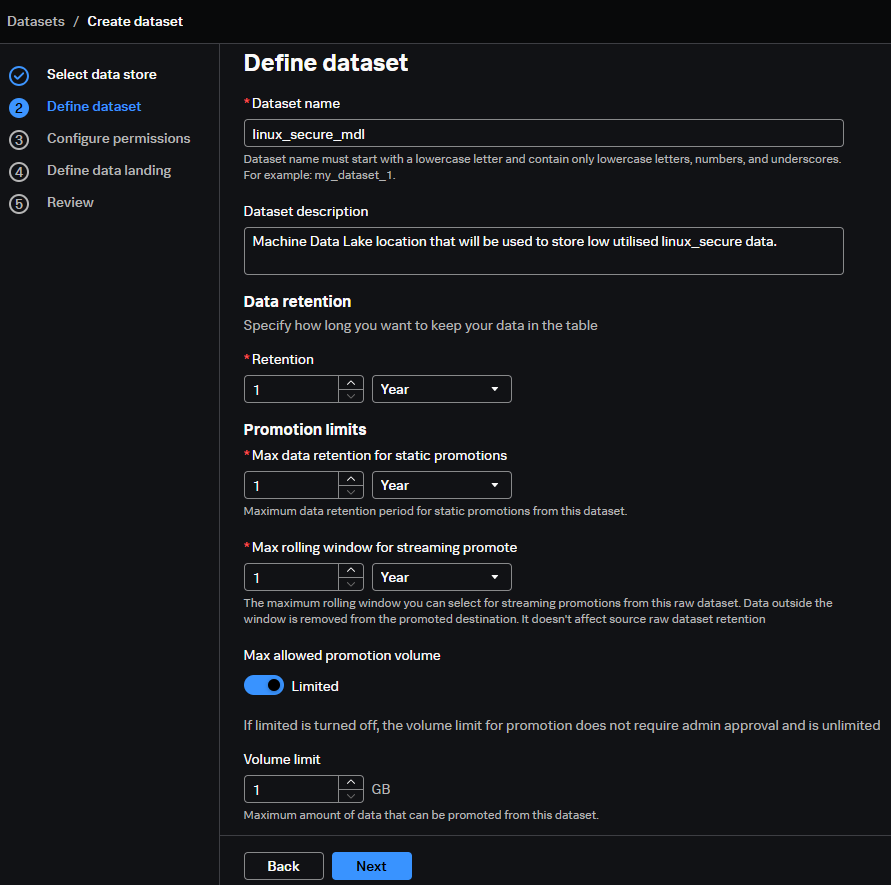
Fill in the details as required below.
- Dataset Name:
linux_secure_mdl - Dataset description:
Machine Data Lake location that will be used to store low utilised linux_secure data. - Data retention options:
leave as is - Promotion Limits:
leave as is - Max rolling window:
leave as is - Max allowed promotion volume:
leave limited as toggled - Volume limit:
leave as 1GB
See example filled out MDL dataset definition:
We covered off quite a few options there, we don't have time to go through which options we chose for what reason but all the information you need can be found HERE
Click nextwhen ready.
On the next screen you can get granular around who has access to perform actions on the dataset. For simplicity we are just going to allow access to Admin for this lab but you can find more information on setting user permissions on MDL HERE
- On the configure permissions screen,
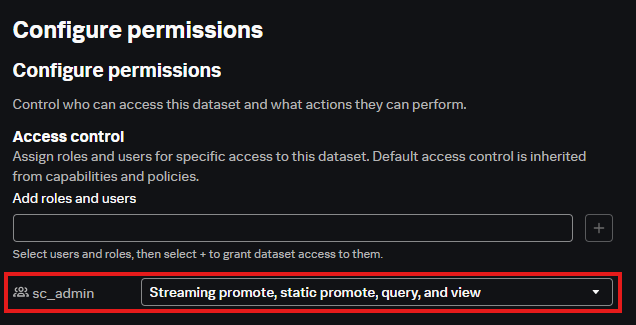
click the dropdown and select the sc_admin role. - Next to the role.
Click the + button next to sc_admin.See example below - From the drop down
select the Streaming promote, static promote, query and view option.See example below
Once selected your screen should look like this:
Click Nextwhen ready.
This screen looks just like a ingest processor pipeline wizard. Well it probably is. But anyway. This is where we can select how the MDL will process the data coming in and select which data lands in the machine data lake raw table we are creating.
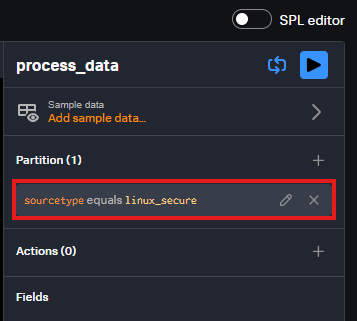
Click the partition by sourcetypeoption.Copy and paste the below into the Value field
linux_secureClick Apply when ready
Your process_data section should look like this:
Click next when ready- Review the summary screen and
click Create Datasetwhen ready.
Once created you should now see your new MDL dataset in the list. See example below:
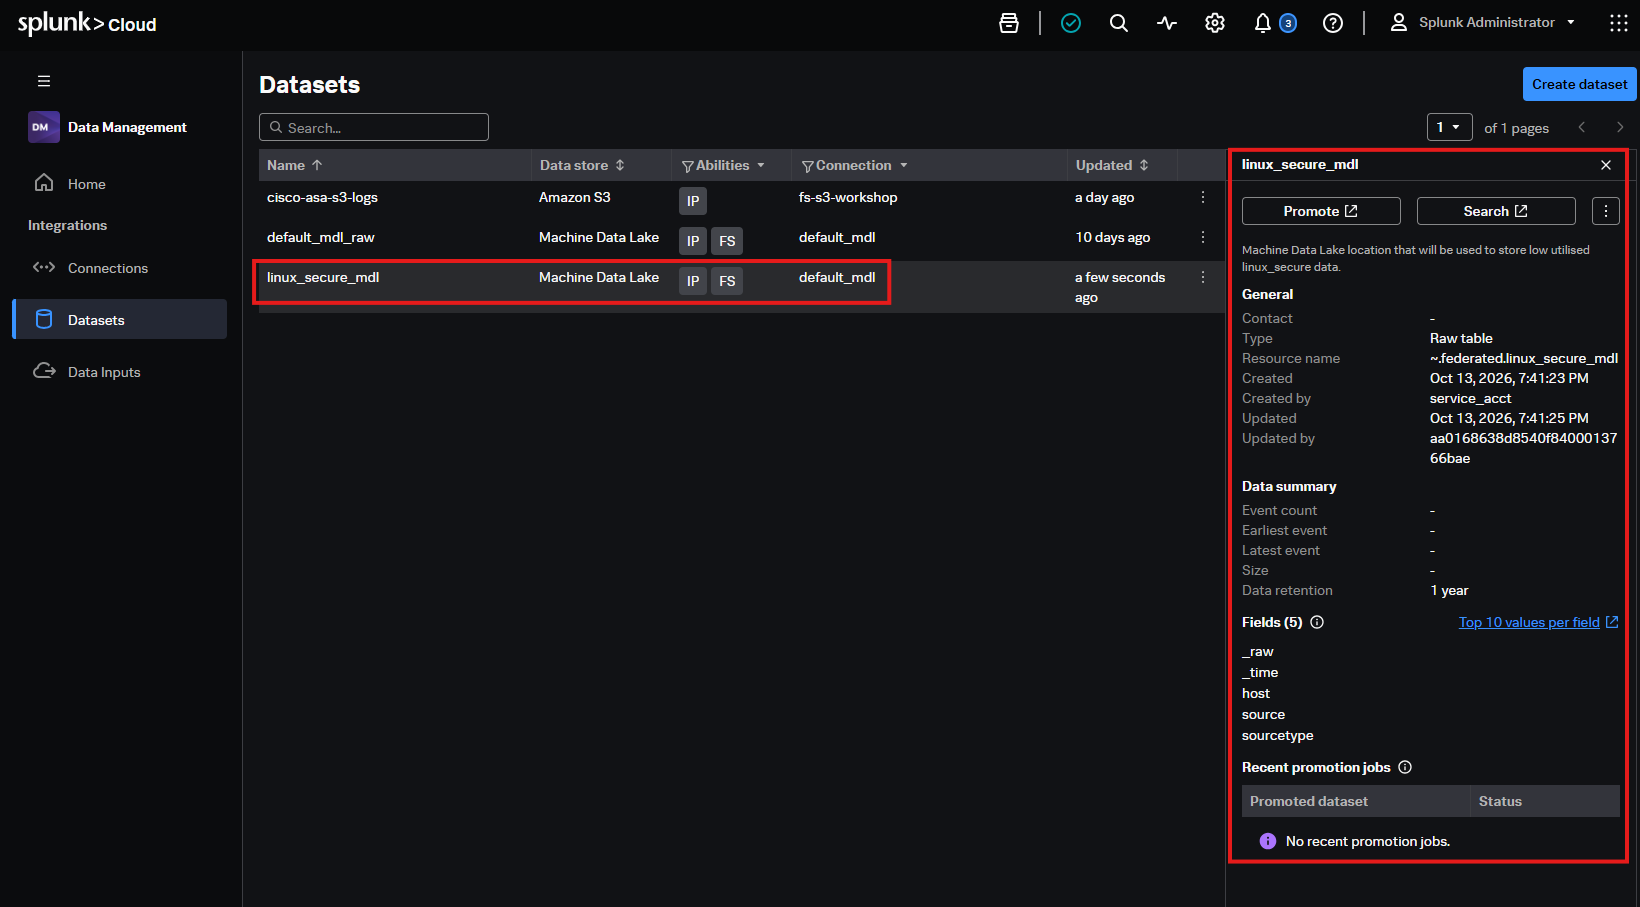
Nice work! Now we can check if data is flowing into it!
Validate Data is flowing into MDL
- From your Splunk Cloud console.
Click Cog icon near the top right-hand side. - From there
select Catalogoption. This should be under the section called Knowledge.
This is our new Catalog service inside of Splunk. From here you can see all of the different indexes and machine data lake catalogs. We should be able to see our new linux_secure_mdl RAW table in the list. See example below:
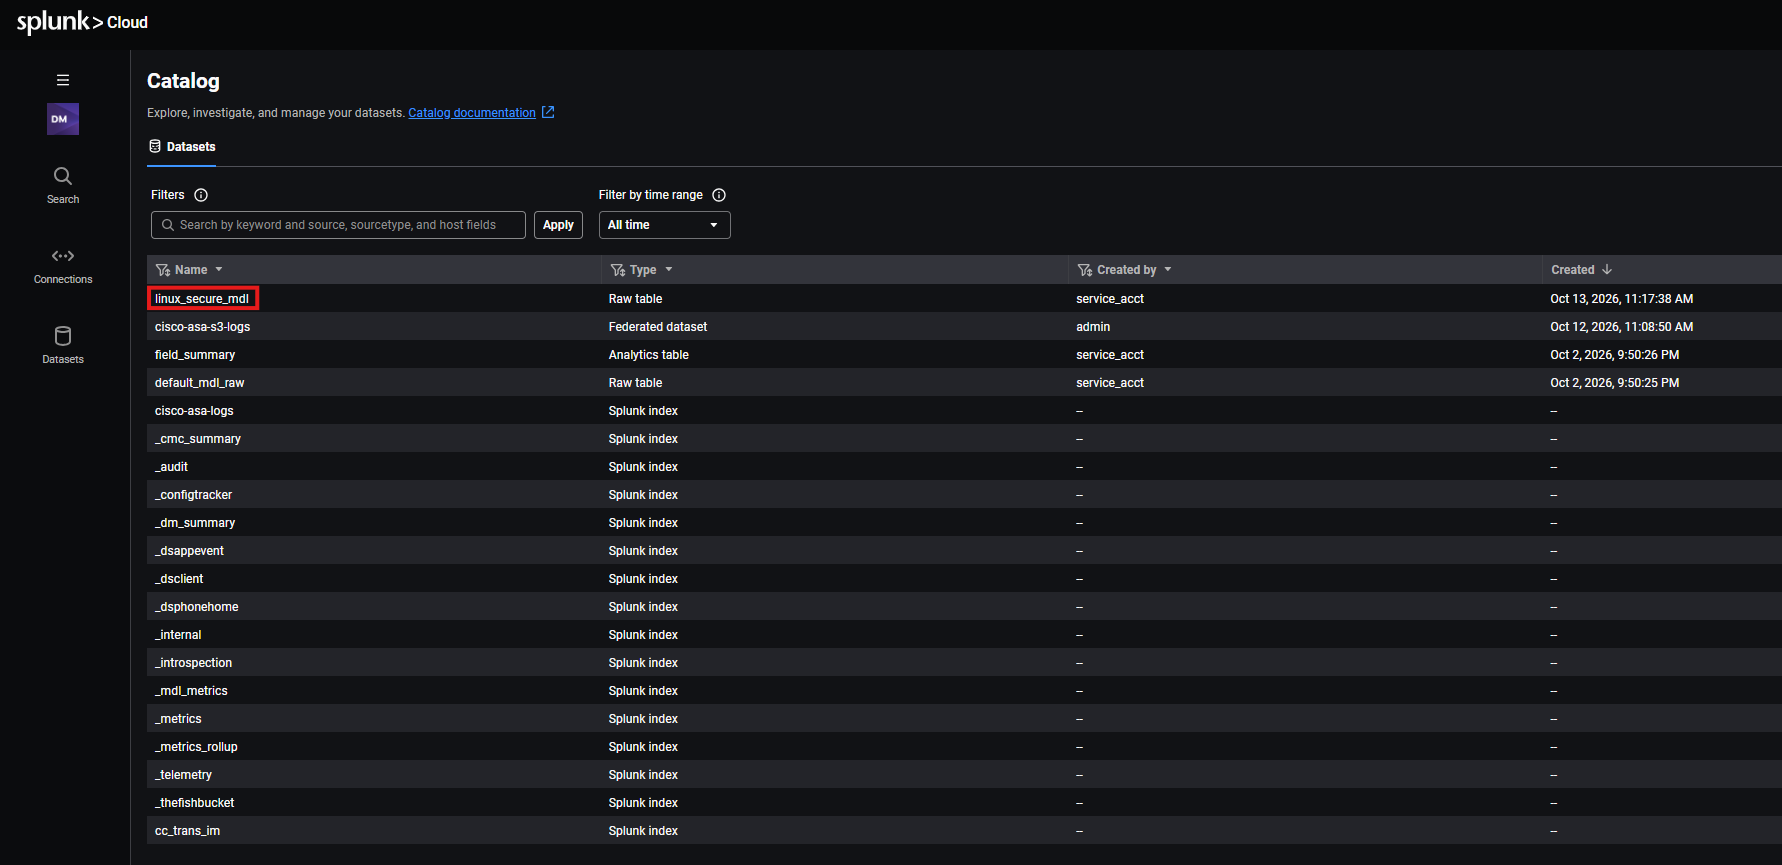
Select the new linux_secure_mdl tablefrom the list.
Now we should see a summary of our new MDL table. See example summary below:
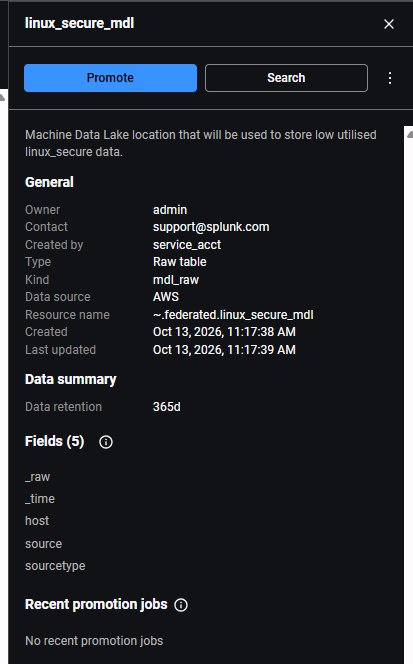
Clicking view hamburger (three dots) next to search will take you to the section where you can get more information on the configured table and edit it as well. But let's stay focused for now.
Click the search buttonto open up the search page for the MDL table.
You will see a promotion warning appear. See example below:
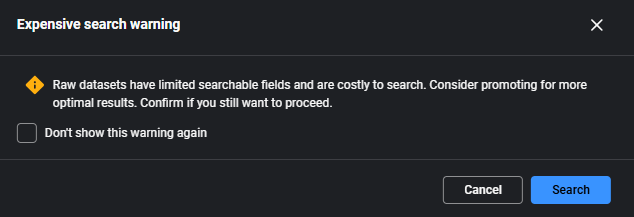
Click the blue search buttonon the warning screen to proceed.
Search results may take up to 10 minutes to start appearing.
By default the search will already appear as a SPL2 query with a limit of 10 results. You should see some results from our recently created MDL table. See example below:
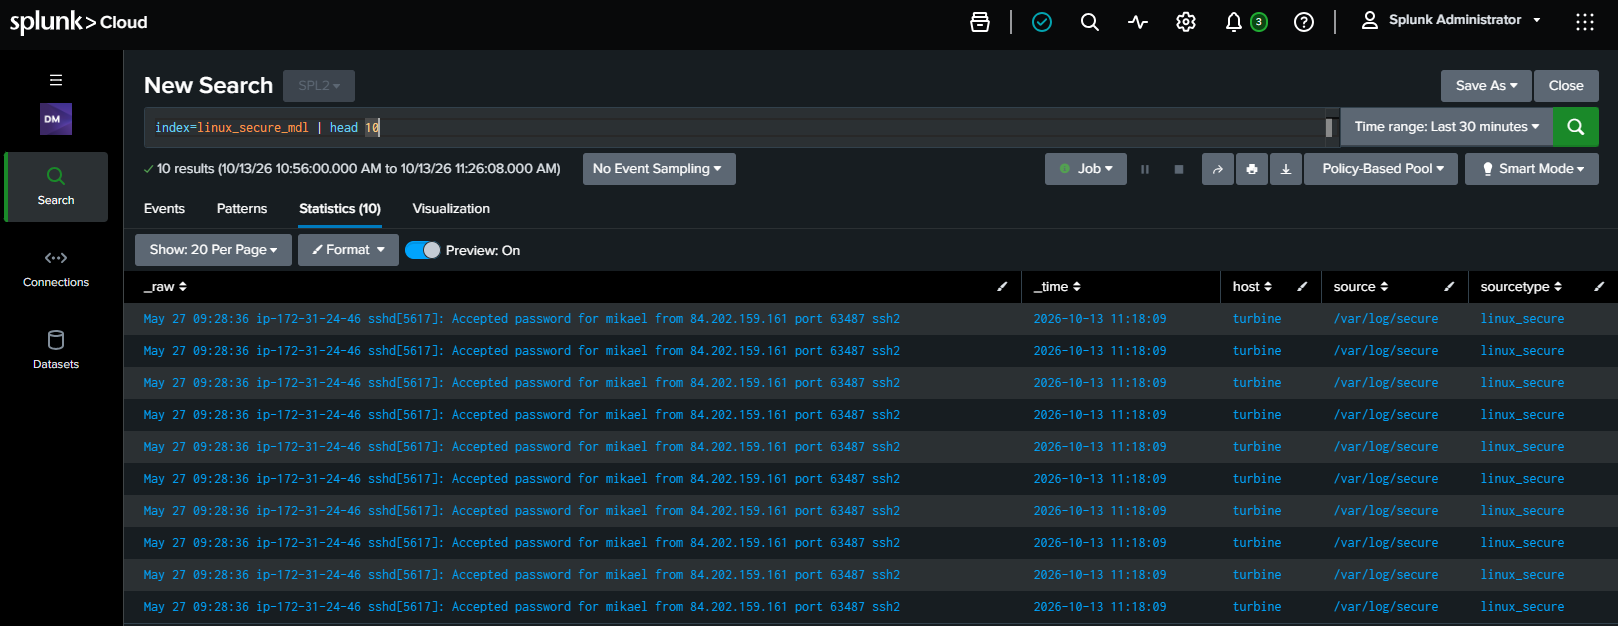
As we have configured the MDL table to route all data matching linux_secure sourcetype, this will mean that we are only sending data to MDL raw now in our new table.
Let's verify we no longer are seeing linux_secure coming into our DDAS storage.
From a new tab open up the Splunk search bar again.You can do this by clicking the Splunk cloud logo on the top left-hand side and selecting the Search & Reporting app.Run the following SPL searchagainst our original linux_secure index.
index=linux_secure earliest=-2mYou will notice we used the earliest=-2m command again to quickly check no new data is coming in.
See example of no results in our search now
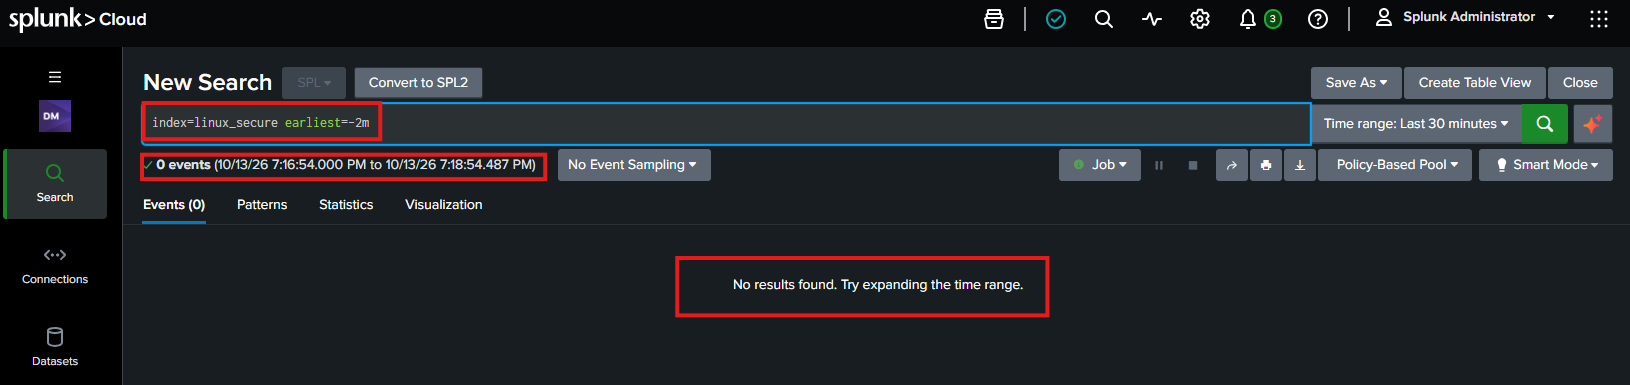
We have now configured the MDL table to take all of the linux secure data and we don't have to worry about it going to DDAS anymore. But what if we wanted to promote a set of that data back to DDAS? Well that is the next part of the lab.